The Release Burndown Chart
This is one in a series on Scrum Intro. The preceding post is here.
Now we come to the release burndown chart.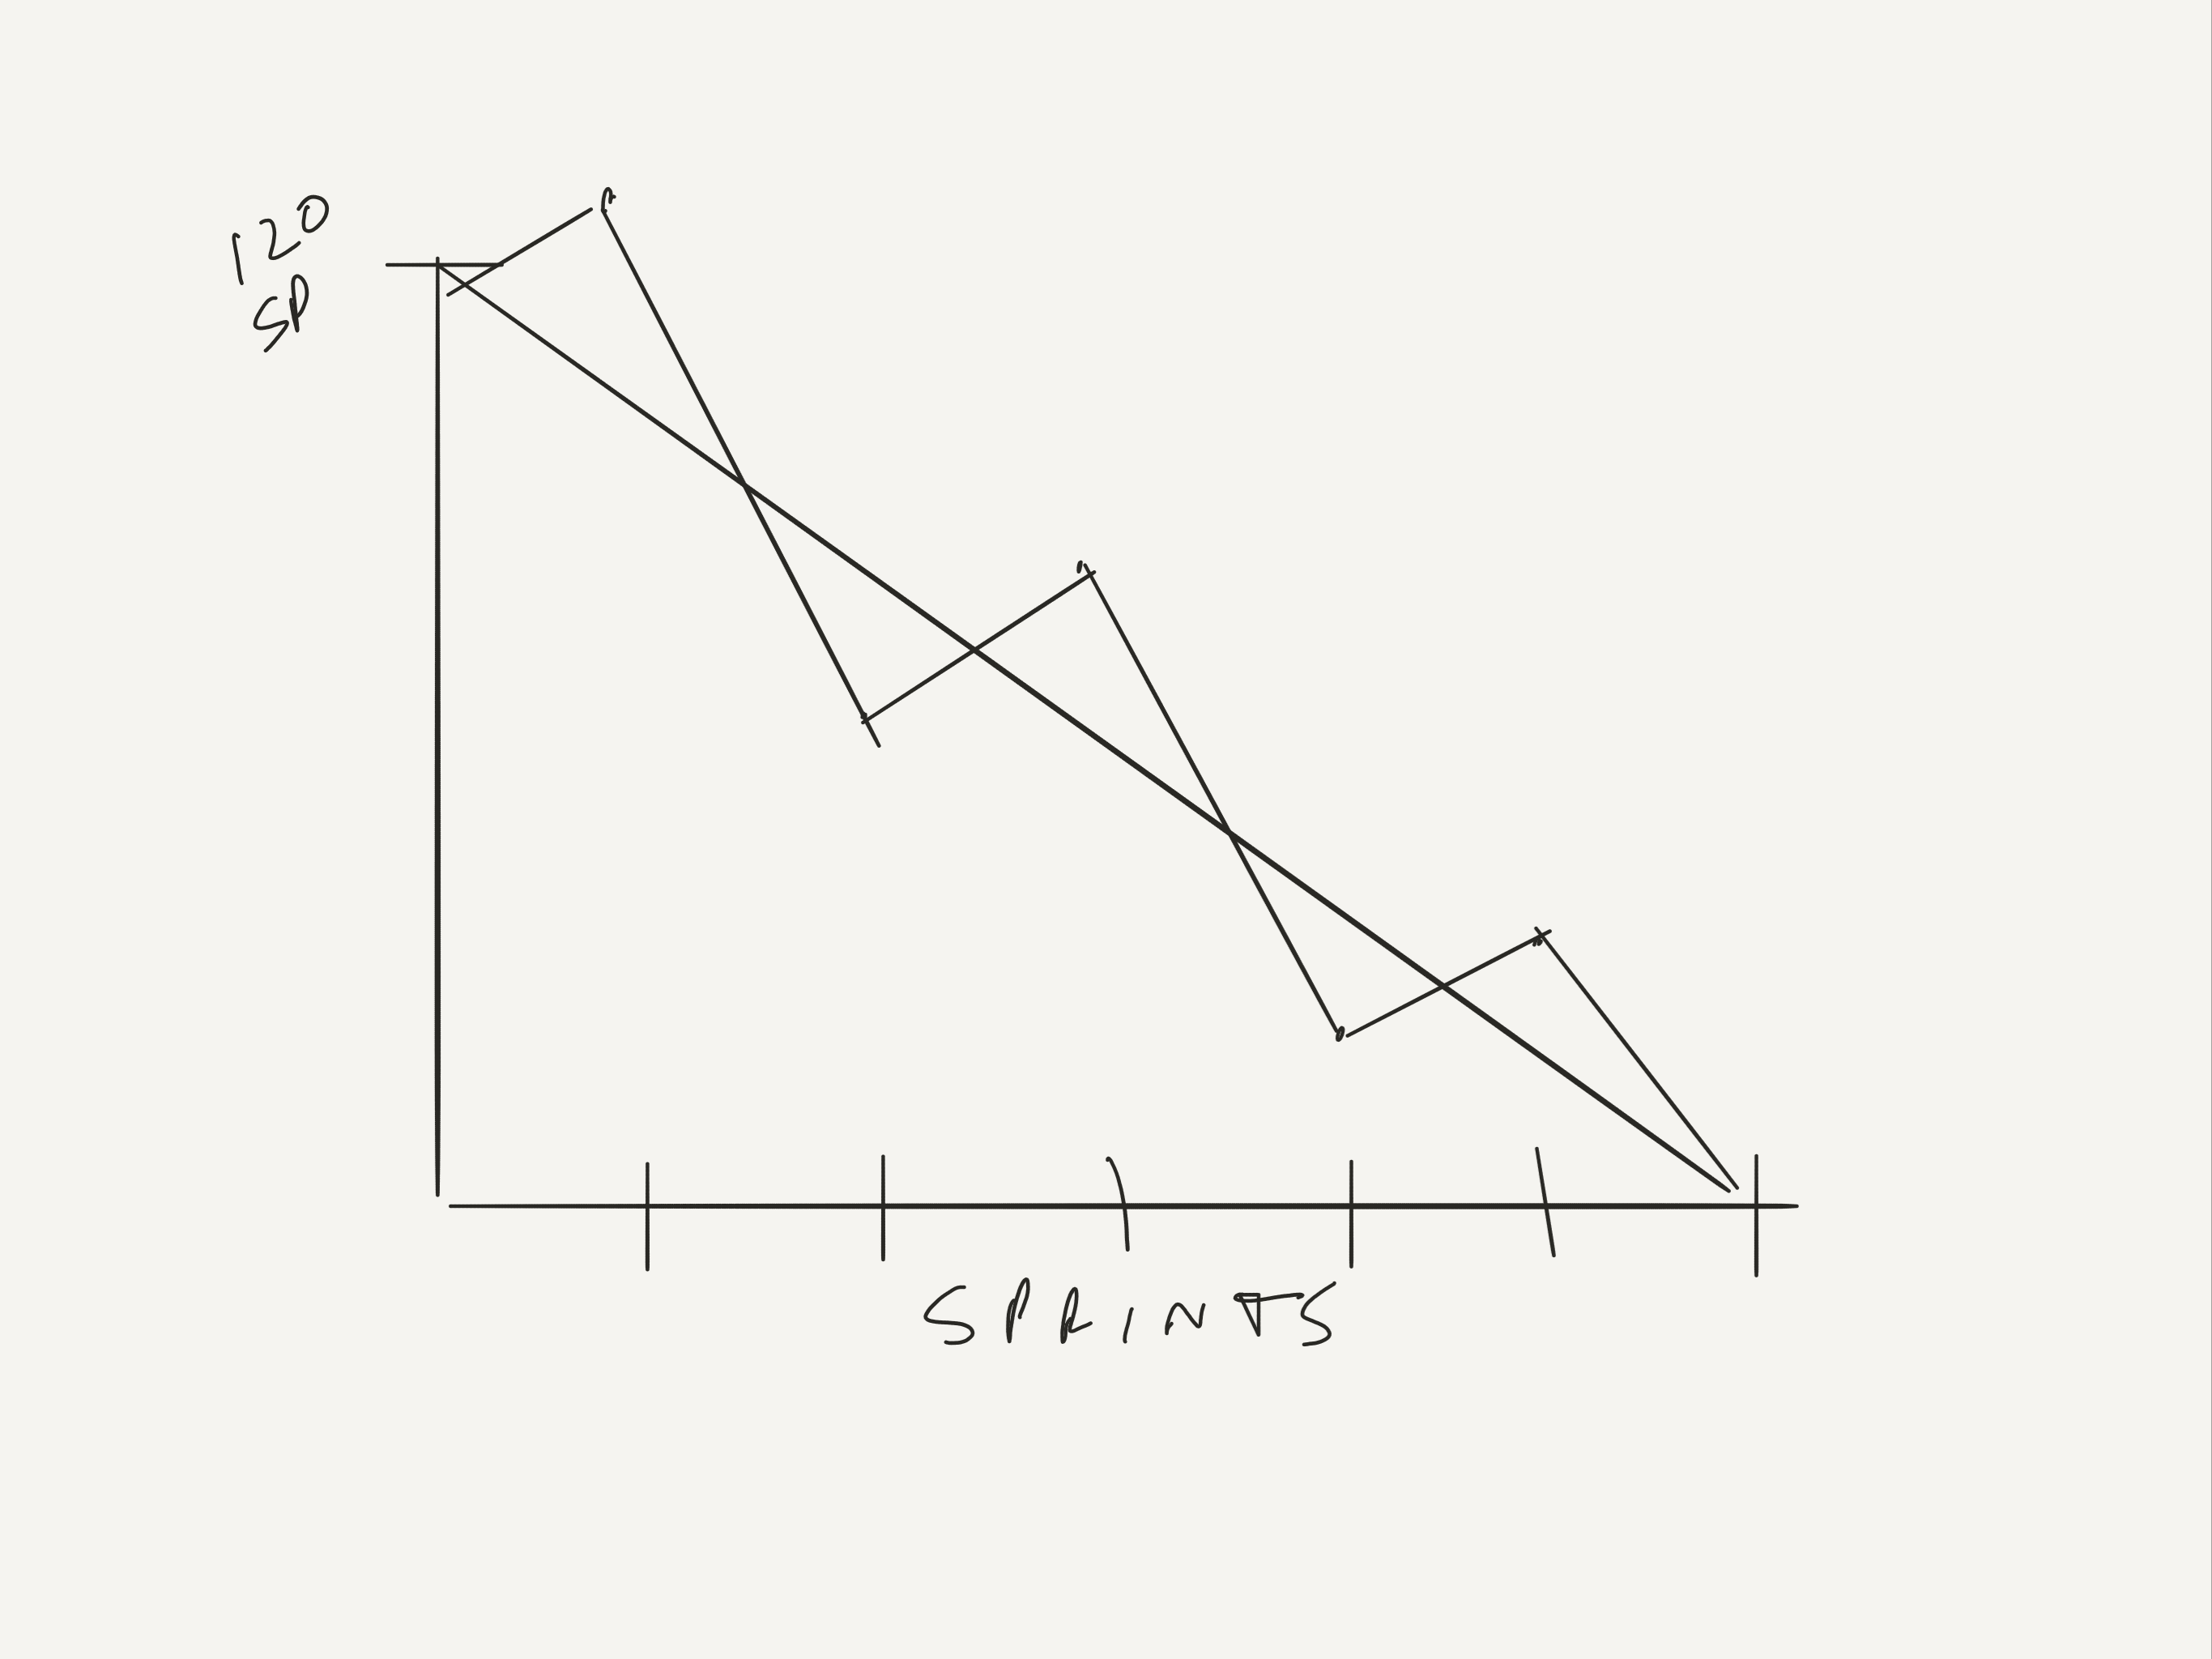
What is the idea?
The first idea is that we want to hit the date.
But let’s agree that things can be a bit more complex.
Side notes:
There are many different kinds of situations in Scrum. We have Continuous Delivery (aka CD) now. Scrum still helps in that situation, but it is different.
We also have people releasing every sprint into production.
The word “release into production” is fairly commonly used in software. It is probably less commonly used for other products, and we think Scrum is also very suitable for any new product development. So, if you use different words, please translate.
So, if CD or releasing every sprint, the concept of a release burndown chart is not meaningful. The concept of a “product burndown” might be.
So, assuming you are taking 2 sprints or more to product a product (6 is a fairly common number to use as an example), then why do we want a release burndown chart?
Why?
Two reasons come quickly to mind.
One is to measure progress. If we start at 120 SPs of work and get down to 60 SPs, then we are in some sense 50% done.
Why is that useful? Because I think it gives us the transparency to “take arms against a sea of troubles, and by opposing, end them”. It makes us cut through the crap and get stuff done. On time.
It keeps managers from canceling projects that have made significant progress. (That has been done to waterfall projects, unfairly.)
So, I am suggesting that the common (not universal) practice in Scrum is to (eventually) set a date. We have a stable team, and therefore budget is fixed. And the flexible part is scope (or “how many stories will we get done in the timebox?”). Another flexible part is “how much will the SM raise the Velocity of the team?”
Here an example picture:
[Picture to be added.]
One axis is story points, or the total of the SPs for all the stories that are “remaining”. We are measuring “work remaining”. The other axis is time, divided into 6 sprints. So, we measure work remaining every sprint. And get transparency on that.
Side note: One of the purposes of the Release Burndown is greater transparency (this benefits many things). Obviously, humans are not always honest. So, for the Release Burndown chart to be effective, the Team must be honest.
Work Remaining means also that we can potentially redefine ALL of the work. We can add stories, we can remove stories. We can break stories up (or break them down, if you prefer). We can re-story point stories. We can redefine stories or re-write them. So, then, the Release Burndown becomes as accurate as humanly possible as of that moment in time.
But why have a release burndown chart?
The second reason.
This information enables the Team to self-organize (around a common goal of hitting that date), self-manage (as if they were adults), and self-direct themselves to greater success. Or at least less failure.
Of course success and failure are not completely defined by hitting a date. But the date is the key element. The date is important because customers care so much about the date (or getting it earlier). And business (for a variety of reasons) cares about the date.
Side note: We discuss elsewhere at more length that happiness/fun and sustainable pace are also very important. And while we are increasing velocity, we must also insist that happiness/fun is going up, and hours are normal (I’ll say 40 hours per week, but we could debate the exact number of hours). More on this elsewhere.
So, anyone in the Team can use the Release Burndown chart. It is mainly for the Team.
Imagine a discussion after Sprint 3, heading toward a release in Sprint 6:
Person1: Wow! We are way over. By 20 story points.
Person2: Yes, we’re not going to make that date if we continue like this. We have to hit that date. [IRL, hitting the date is not always that important. But let’s imagine in this case that it really is.]
Person3: We still have some big stories. We need to break them down and see if we can move some of those story points to the next release. You know what Pareto says.
Person4: ScrumMaster, what can we do to increase Velocity?
Person5: If we could fix the [X impediment], I think the Velocity would go up 5 points.
Person6: We need to stop scope creep too. If anything new comes in, we have to tell the business side that something has to go out.
Person7: I’ll take some time in the next 2 days to help with the [X] problem.
This conversation all started with an observation about the Release Burndown chart. We are assuming that the Team can act like adults and, to some degree, control their own destiny. It may not happen, or may not be able to happen, every time. But it can happen often enough.
Notice also that there was no discussion of working overtime or on weekends.
Hope that helps your Team.
The next post in this series is here. The whole draft book can be found here.
« « Course & Workshop Summary – For January 2 Minute Survey || Inhouse Courses and Workshops » »
2 thoughts on “The Release Burndown Chart”
Leave a Reply
You must be logged in to post a comment.
Subscribe to this blog
Interested in a Lean-Agile-Scrum course or Workshop?
Recent Posts

Categories
- agile
- agile business
- Agile principles
- Better Agile
- business value
- BV Engineering
- Change Management
- courses
- Events
- freedom
- Getting started
- impediments
- Innovation
- Jeff Sutherland
- Kanban
- Key problems
- knowledge creation
- leadership
- lean
- Lean Software Development
- learning
- Listings
- Little's Law
- Little's Second Law
- managing agile
- Misc
- Nokia Test
- Paying
- People issues
- Recommended reading
- Release Planning
- Resources
- scaling
- Scrum
- Scrum Intro
- Scrum meetings
- Scrum roles
- ScrumButt
- ScrumButt Test
- Self-organization
- Talks
- Teams
- Uncategorized
- video
- WIP
- Yogi Berra
Pingback: The Sprint Burndown Chart - Lean Agile Training
Pingback: Working Product and the DOD - Lean Agile Training